New trend templates
Three new trend templates are now available.
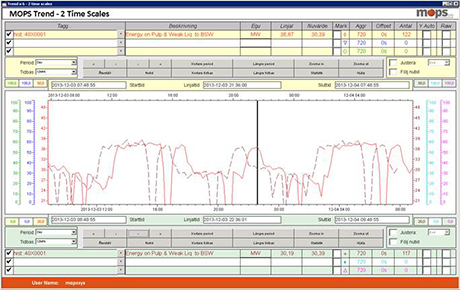
• 2 X-scales
This trend template has 2 X-axis connected to 3 curves each. The two X-axis are totally separated from each other, allowing you to shift one set of curves in time, or even to use a separate time base and resolution for one X-axis.
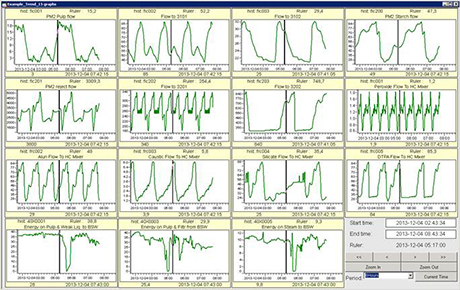
• 15 graphs
The trend template below supports 15 mini-graphs with connected time period, time base and ruler.
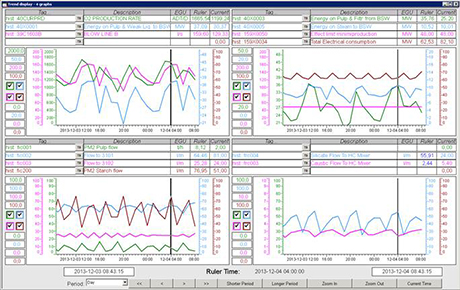
• 4×4 graphs
The trend template below supports 4 graphs with 4 curves each, all with connected time period, time base and ruler.
Defect Distribution display
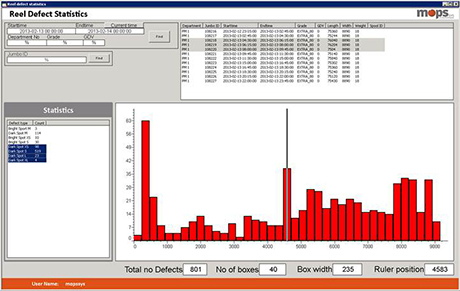
The new “Defect distribution” display in WinMOPS present Paper Defects distribution in Cross Direction for one or many Jumbo reels.
The following features are supported:
• Possibility to select time period and filter on Grade or Basis Weight
• Filter on one or many Paper Defect types
• Increase/decrease presentation accuracy by changing box width
New Profile display
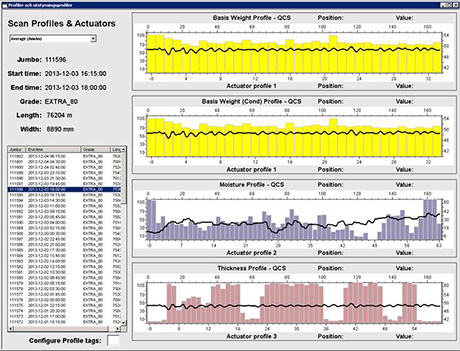
There is a new profile display in WinMOPS that presents Scan profile average together with Actuator profile average over a selected Jumbo reel.
New calculation types in Classification
The following new calculation types are added to the Classification.
• RRT Range Rim Total. Calculate streak in Roll by average of Param1 % of min/max values of raw profile
• RRC Range Rim CD direction. Check streak in Roll by calculate average of Param1 no of highest and lowest values of set average profile
• RRM Range Rim MD direction. Check streak in Roll by calculate average of Param1 no of highest and lowest values of MD average profile
